
6.2 Email Sending Statistics and more
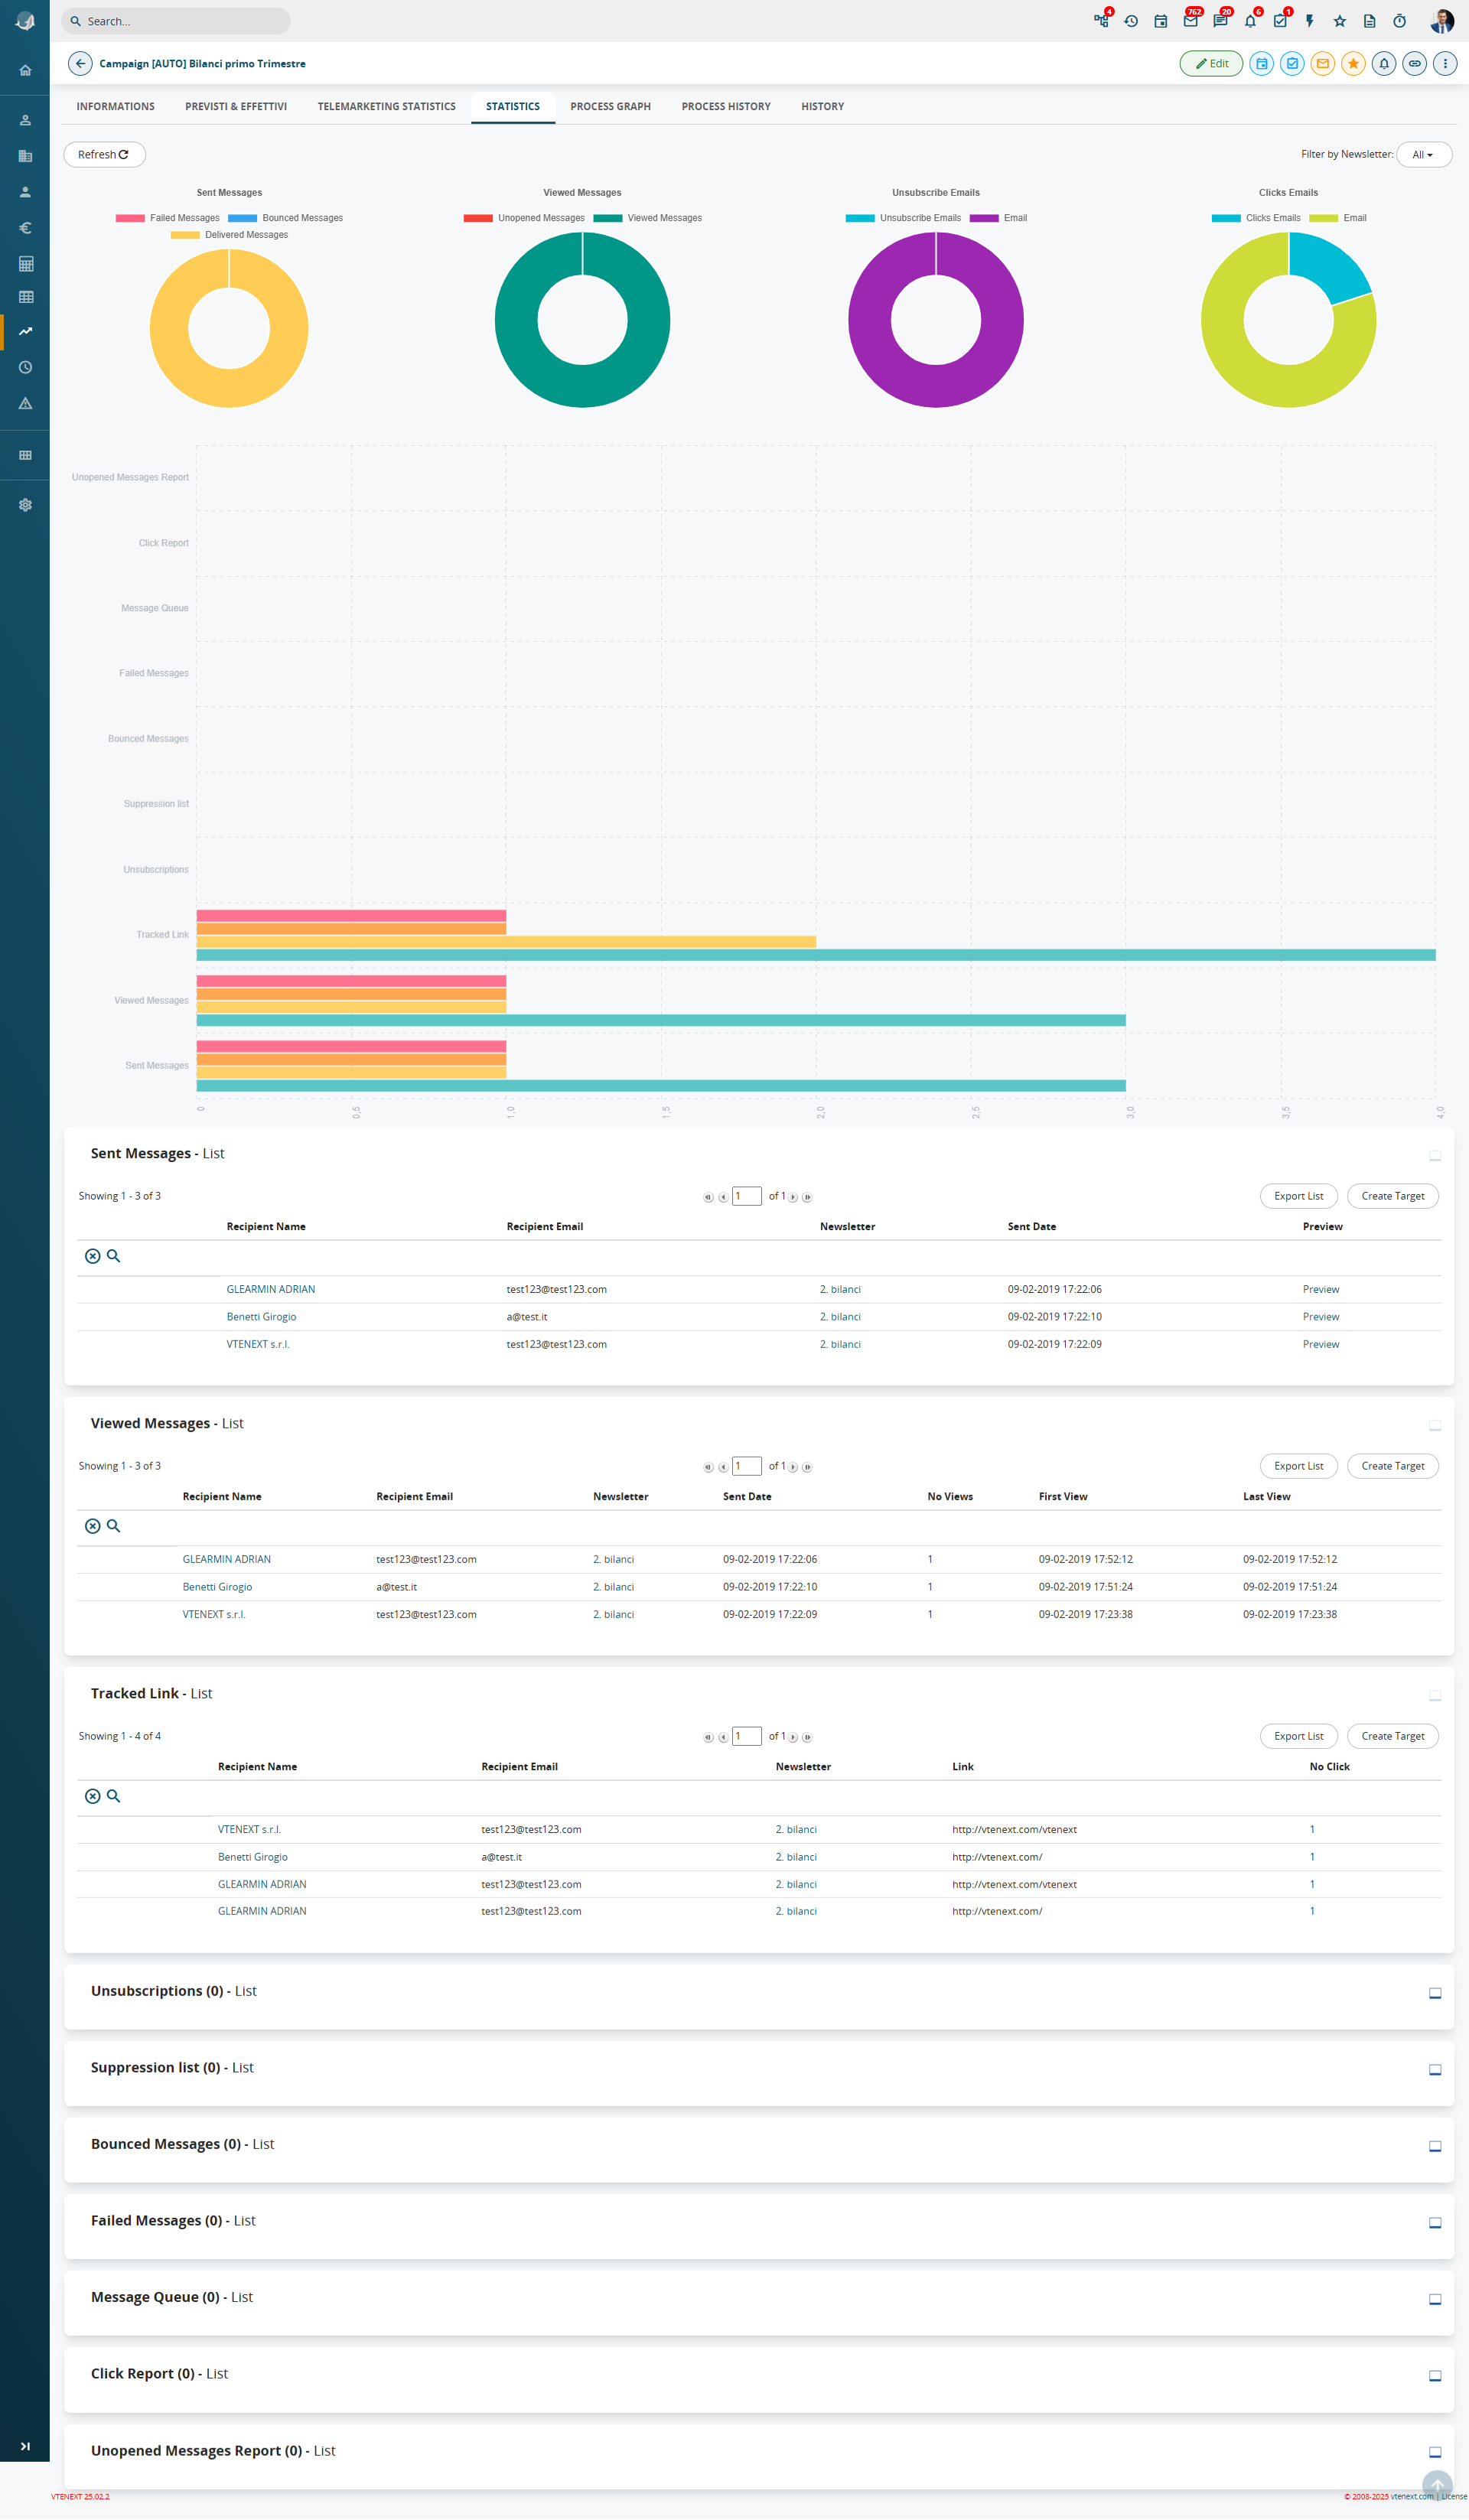
Once the sending is completed, within the Campaigns module you can access the Statistics tab to view a summary chart of the statistics and the detailed data for each metric.
IMPORTANT: vtenext inserts an image into newsletters that is used to notify our system that the email has been successfully opened, allowing the opening to be counted in the statistics. Some servers, where services such as Libraesva Email Security or similar are active, completely block this image. This results in the newsletter opening not being recorded.
We are aware that, for this reason, the tracking system is not 100% reliable, and it is currently not possible to work around this scenario (which is, however, relatively uncommon). We would also like to point out that this limitation is present in other newsletter services as well, which use the same method we do (now considered an industry standard).
Initially, you will see a donut chart, which allows you to immediately view some interesting statistics about the sent newsletter:
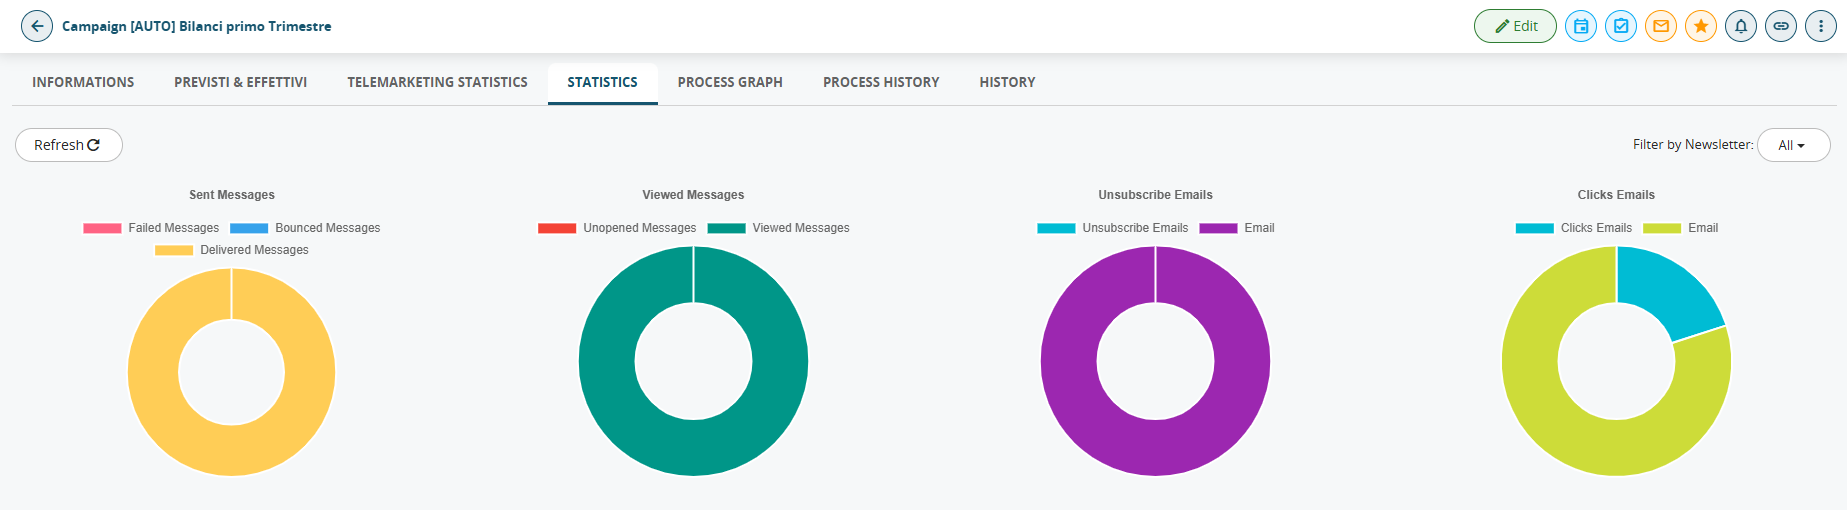
| Emails Sent |
color-coded breakdown between Delivered Emails, Bounced Emails, and Failed Emails, where you can see the number of emails that were actually delivered, along with the number of bounced and failed emails. |
|
Emails Opened |
color-coded breakdown between Opened Emails and Unopened Emails. |
|
Unsubscribed Emails |
color-coded breakdown between Unsubscribed Emails, meaning all email addresses that unsubscribed by clicking the appropriate link, and Emails, meaning the remaining email addresses that have not unsubscribed. |
|
Email Clicks |
color-coded breakdown between Email Clicks, meaning all email addresses that clicked on at least one link, and Emails, meaning the remaining email addresses that have not clicked on any links in the received newsletter. |
By hovering the mouse over each individual slice, you can view a tooltip showing the value represented by that specific portion of the statistics.
Below the donut chart, there is a horizontal bar chart displaying the same statistics, presented in a different format so they can be interpreted in an alternative way (each user can choose how they prefer to read their statistics).
Below the horizontal bar chart, you will find the individual blocks, which allow you to view the list of emails by status. From each of these blocks, you can create new Targets using the “Create Target” button, or export the names to an Excel file using the “Export List” button.
Finally, in the statistics section, thanks to the filter called “Filter by Newsletter” located at the top right, it is possible to access the statistics for the overall campaign (which therefore consider all newsletters associated with the campaign) or for a specific newsletter.
|
Message Queue |
emails that have not yet been sent (when sending is complete, this column must be blank) |
|
Sent messages |
correctly sent and received emails |
|
Viewed Messages |
for each opened email: number of times the email has been opened, date and time of first and latest opening, link to recipient’s record |
|
Tracked Link |
if there are any links in the body of the email, the system tracks the number of clicks by each recipient for each link |
|
Unsubscribes |
recipients who clicked the unsubscribe link |
|
Bounced Messages |
emails sent but not received by the recipient (due to unresponsive server, full mailbox…) |
|
Email failed |
email that have not been sent (probably due to the address error) |
|
Suppression List |
suppressed email addresses |
N.B.: bounces are processed once a day via a cron job.