
13.1.3 Advanced Reporting Examples
In this section, we will explore in greater detail some of the configurations introduced earlier and examine additional steps of the report creation wizard that have not yet been covered.
Unlike the previous chapter, we will not walk through the complete report creation process again, as it has already been described in detail. Instead, we will focus on more advanced features and configurations, illustrating them through practical examples that will help you create more complex and structured reports.
The examples provided in this chapter are for illustrative purposes only and are not necessarily representative of real-world cases.
Each organization and project has its own specific characteristics, data, and objectives, making it impossible to define practical examples that apply to all operational needs.
Therefore, this guide is not intended to provide recommendations on which fields to use or how to structure reports for a specific business context. Instead, it aims exclusively to illustrate the features of the Reports module and the main ways in which the tool can be used.
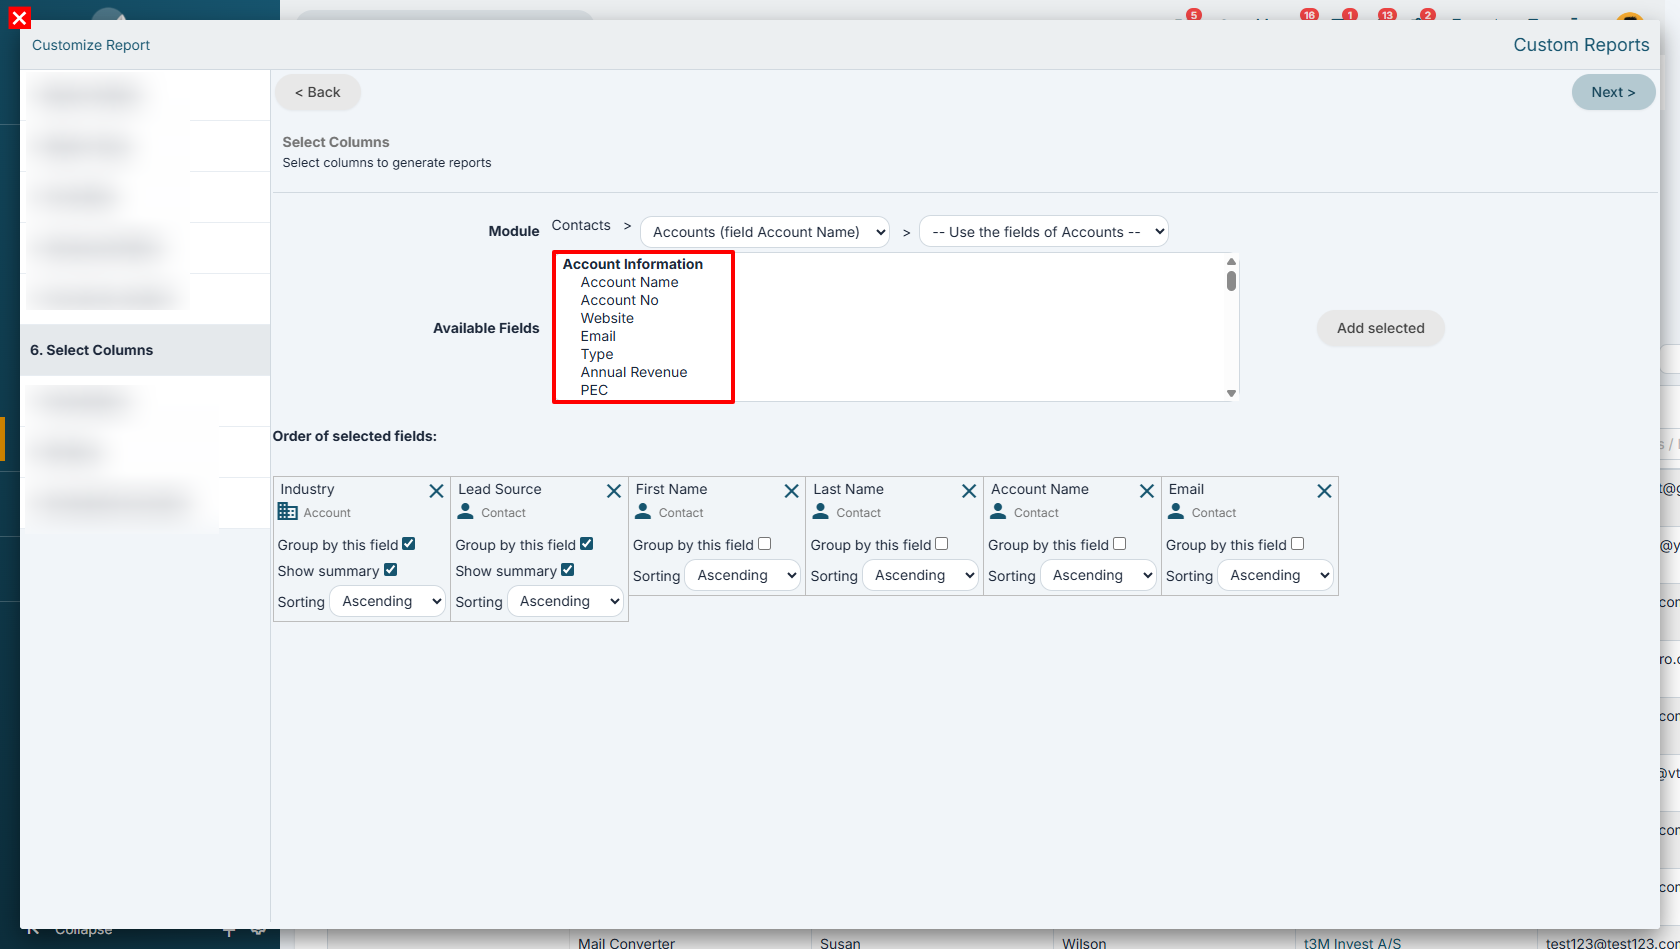
How to Select Fields from Related Modules
To select information from the related Account, starting from the Contacts module, you can use the panel located in the upper-right section of the screen, which displays the available relationships.
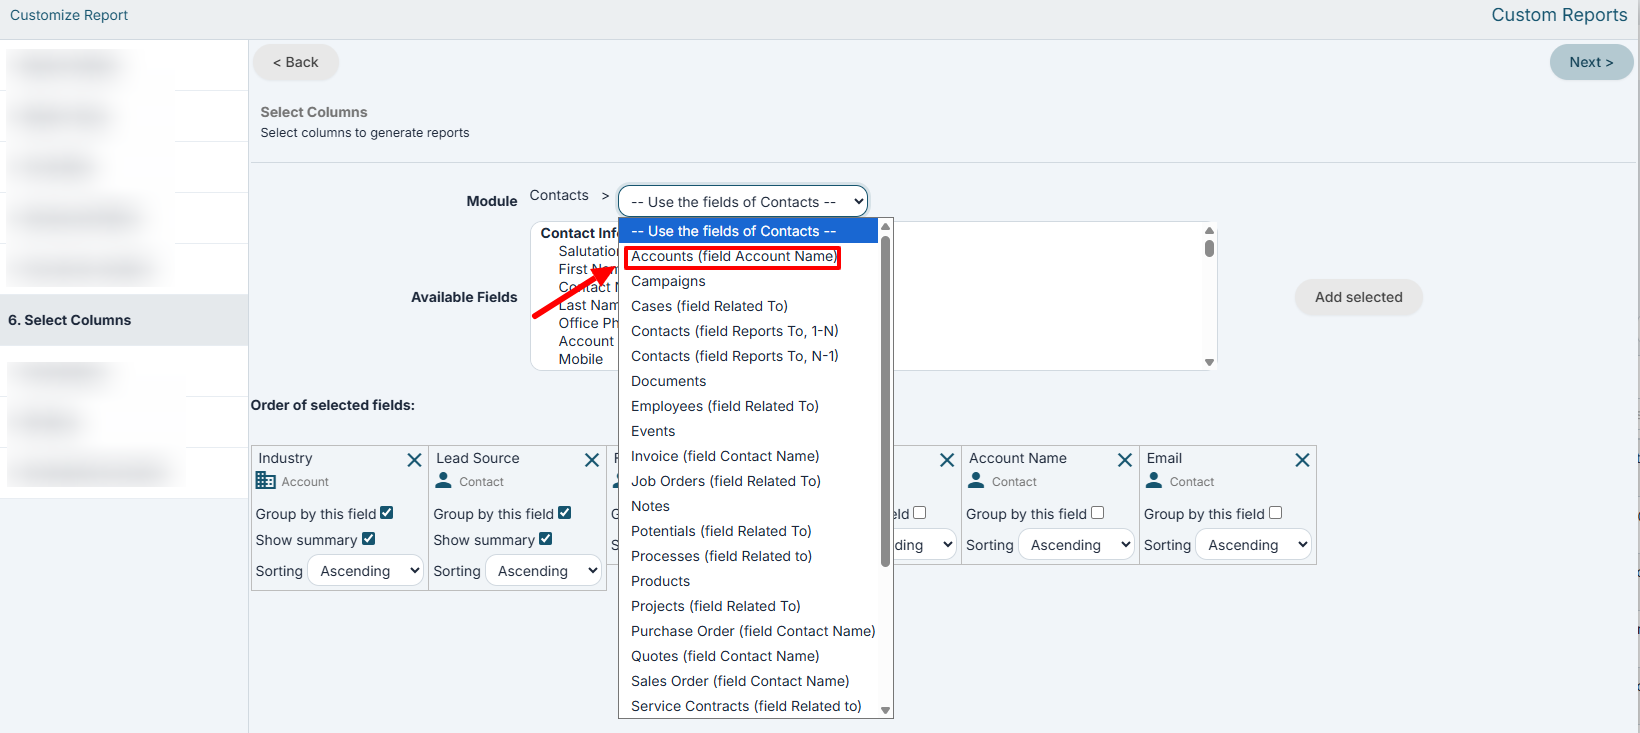
Once the desired relationship has been selected, the fields of the related module will appear in the lower panel and can then be used within the report.
Combining information from different modules enables the creation of more advanced reports and statistics, which can be used, for example, to analyze sales performance and monitor business processes.
Example reports:
- List of companies with the number of associated contacts, combining data from the Accounts and Contacts modules.
- Number of visits carried out per customer, combining data from the Accounts and Visit Report modules.
- Number of calls made per customer, combining data from the Accounts and Calendar modules.
- Analysis of sales opportunity management, combining the Accounts, Opportunities, and Quotes modules to monitor deal progress and conversion rates.
- Value of opportunities generated by Lead Source, combining the Leads, Opportunities, and Sales Orders modules.
- Average deal closing time, combining the Opportunities, Quotes, and Sales Orders modules.
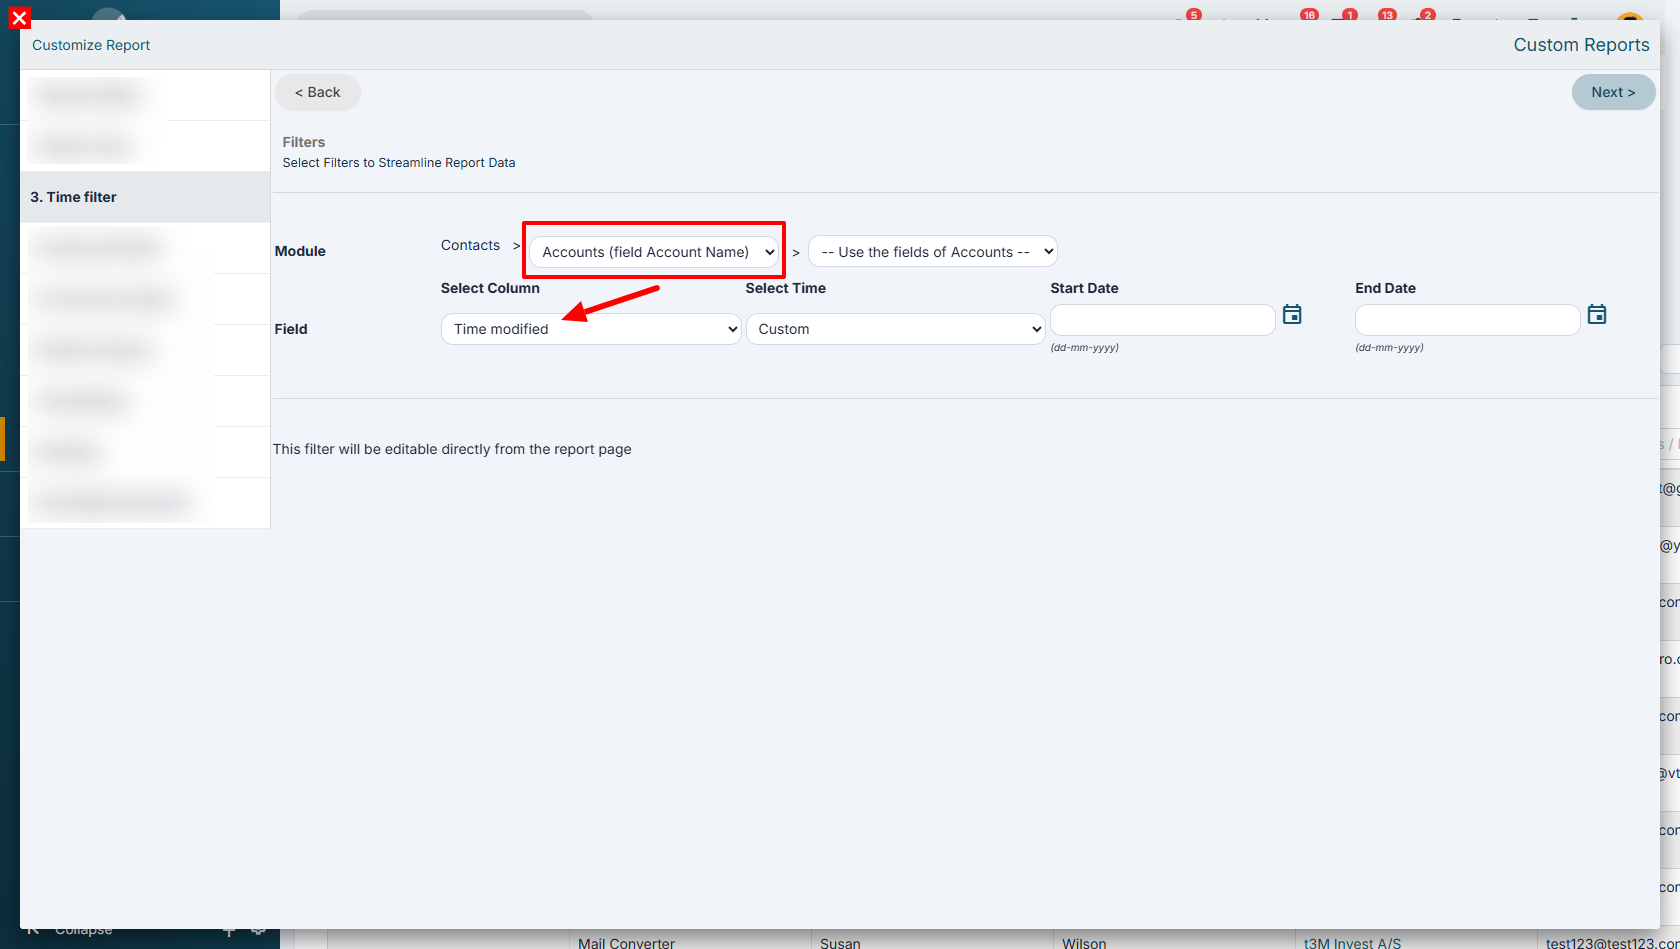
Advanced and Date Filters on Related Modules
For both types of filters (Advanced Filters and Time-Based Filters), the configuration logic is the same.
First, you need to select the module from which you want to use a field (for example, Accounts).
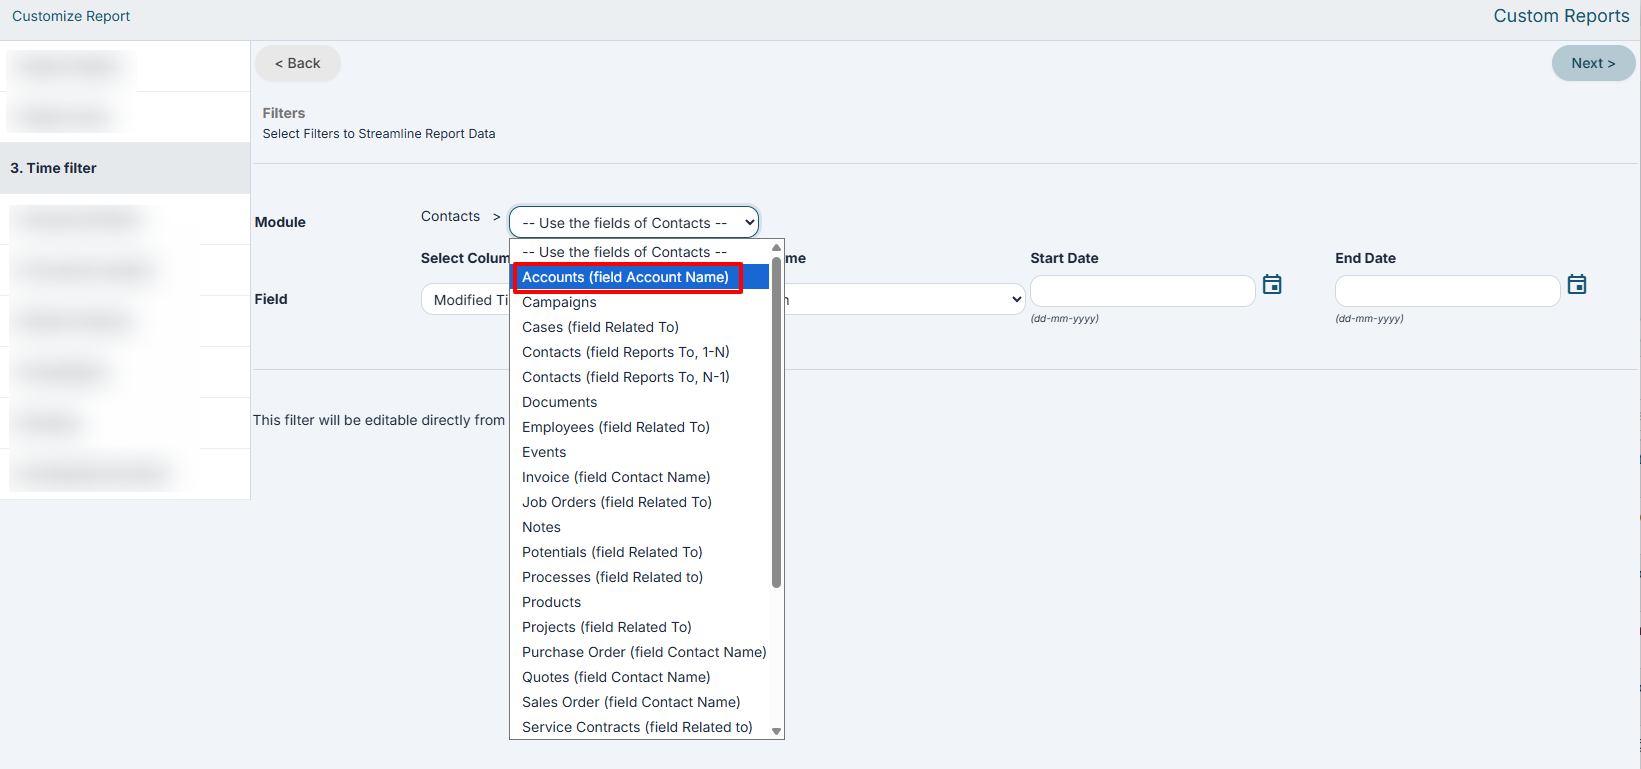
Next, the lower panel will display all compatible fields belonging to the selected module.
Examples of Time-Based Filter Logic
- Companies that have at least one Opportunity with a Expected Closing Date in the current month.
- Companies that have at least one Quote created in the last 30 days.
- Companies that have at least one Invoice issued in the last quarter.
- Contacts linked to an Opportunity created in the last 60 days.
- Leads linked to at least one Task due within the next 7 days.
- Companies that have at least one Ticket opened in the last 30 days.
- Companies that have at least one Sales Order created in the last year.
Examples of Conditional Filter Logic (also usable in time-based filters)
- Companies that have at least one Opportunity with an Amount greater than €50,000.
- Companies that have at least one Opportunity with Stage equal to Negotiation.
- Companies that have at least one Quote with Status equal to Accepted.
- Companies that have at least one Invoice with Total Amount greater than €10,000.
- Companies that have at least one Ticket with Priority equal to High.
- Contacts linked to an Opportunity with a Probability greater than 80%.
- Contacts linked to a Company belonging to the Metalworking industry.
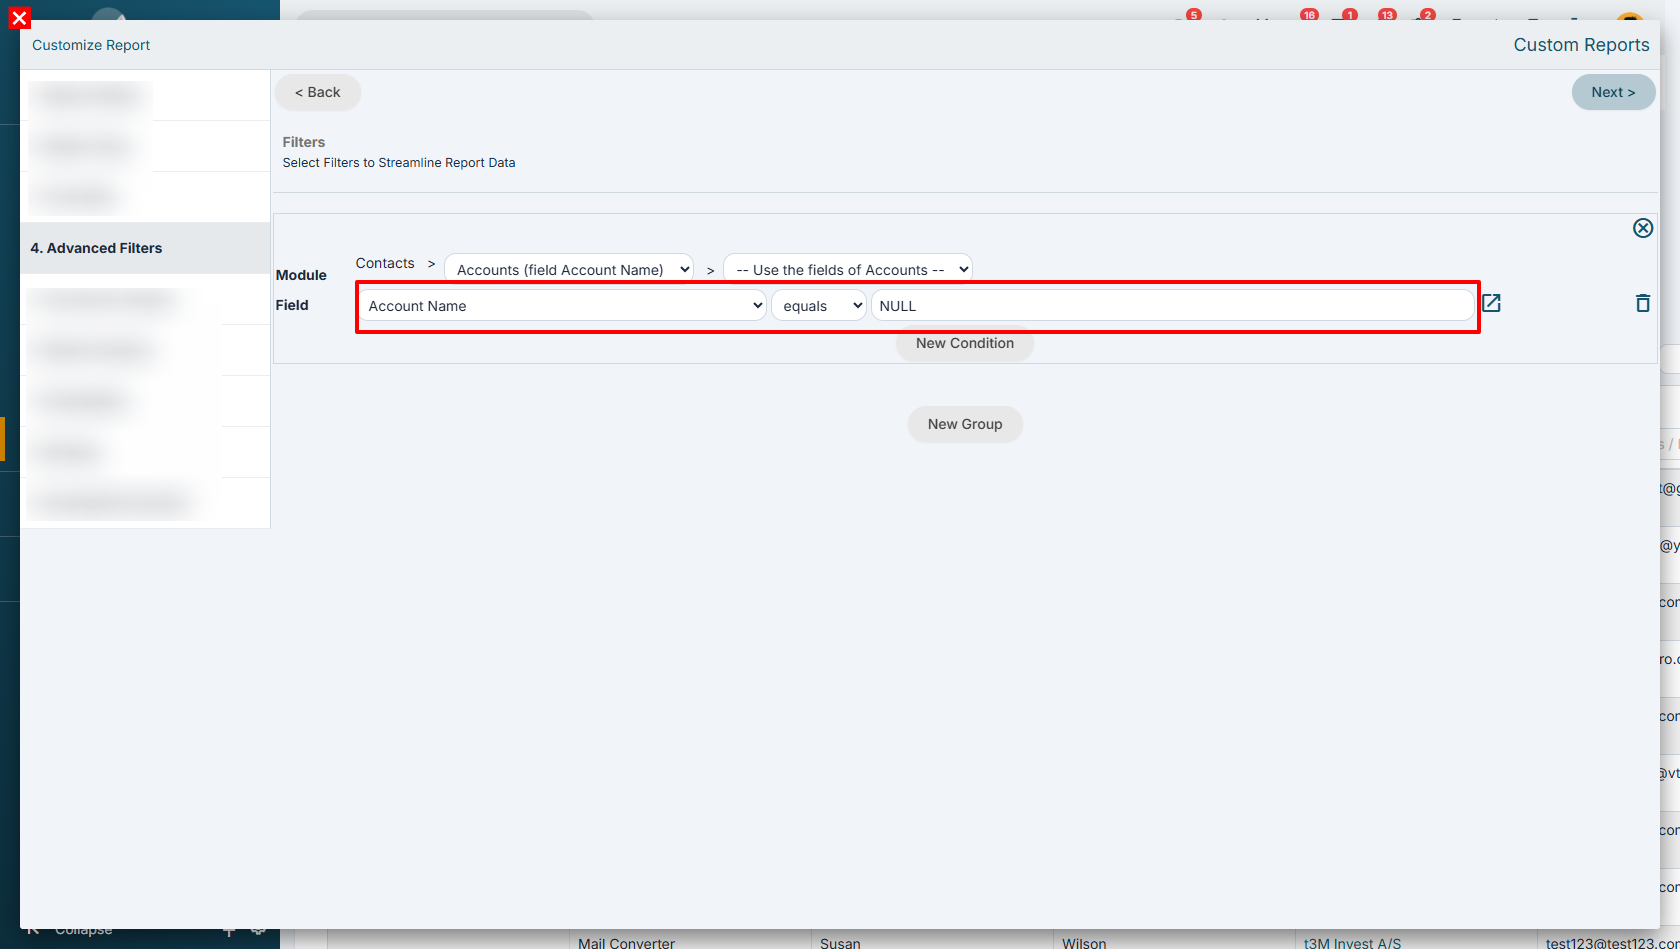
Selecting Records Not Related to a Specific Module
Within Step 4 – Advanced Filters, it is possible to configure a condition that retrieves all records from the primary module that are not linked to a specific related module.
This functionality is particularly useful, for example, to identify:
- companies without opportunities;
- companies without contacts;
- contacts not linked to any account;
- products not included in any sales order.
To achieve this result, simply select any field belonging to the related module and set the “NULL” operator in the last column of the condition.
This will ensure that the report retrieves all records from the main module that do not have any relationship with the selected module.
Below is an example of how to configure this condition.
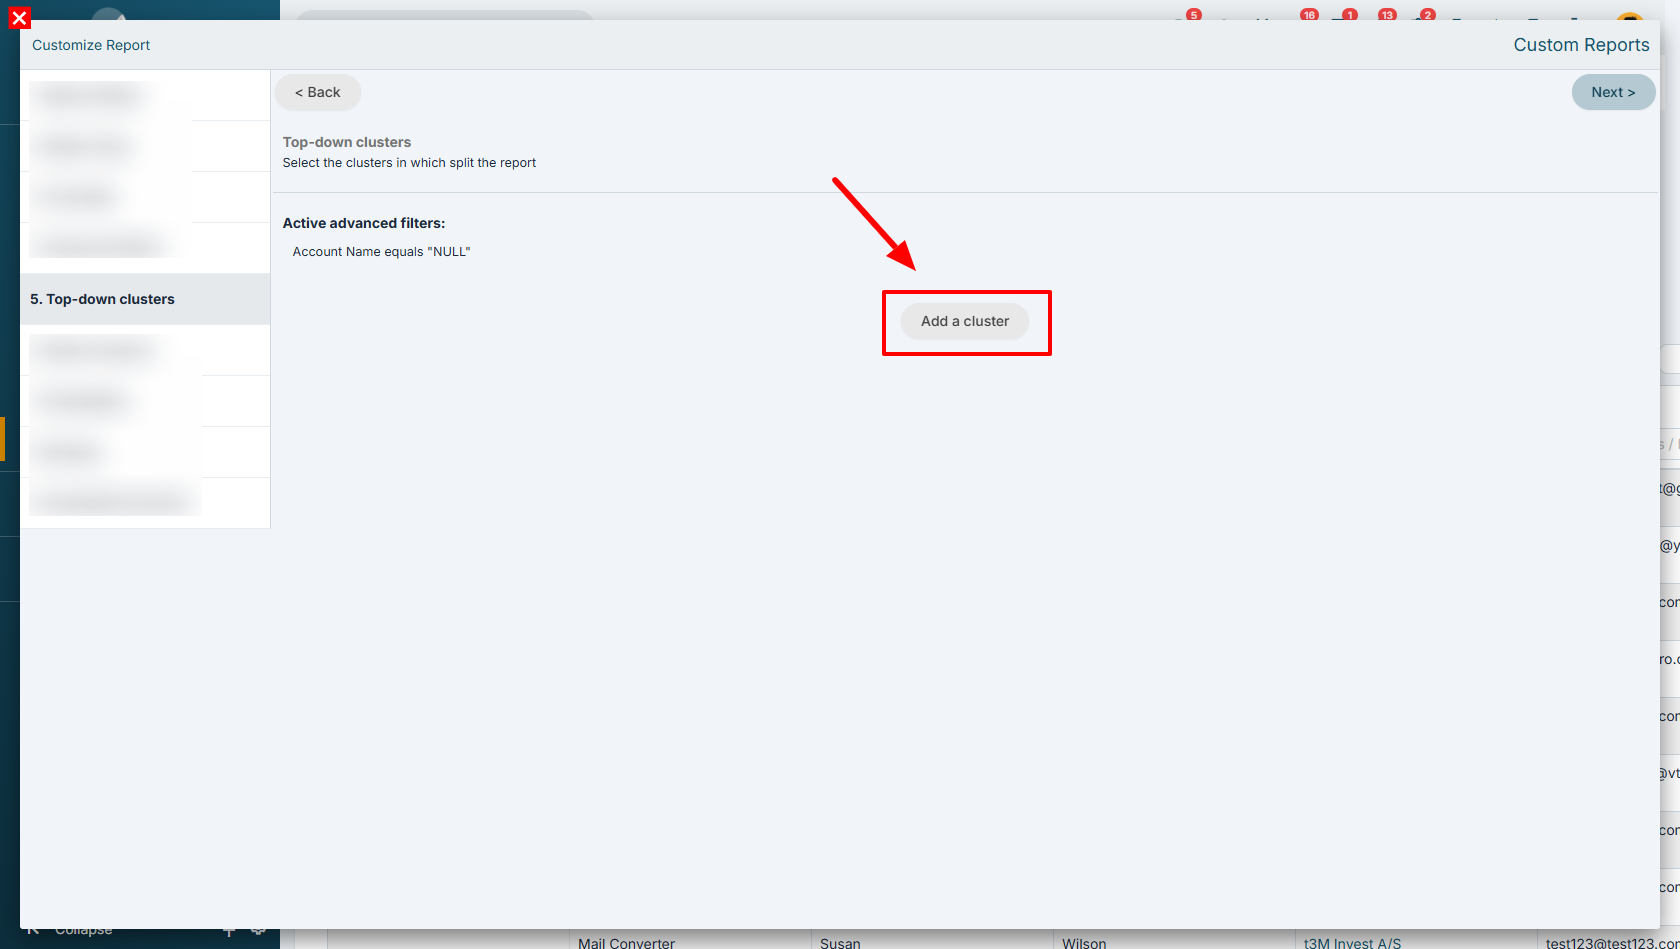
Examples of Top-Down clusters Usage
Within this step, it is possible to create segments based on one or more conditions.
In this way, records retrieved by the report can be classified into different segments according to specific conditions defined by the user.
Segmentation therefore allows data to be grouped according to one or more custom criteria, making it easier to create charts and perform comparative analysis.
To add a new segment, simply click the “Add Segment” button.
In this example, we are creating a segment that identifies all contacts belonging to companies in the Metalworking sector with a revenue greater than €500,000.
This allows these contacts to be grouped within the same segment and analyzed separately from the others included in the report.
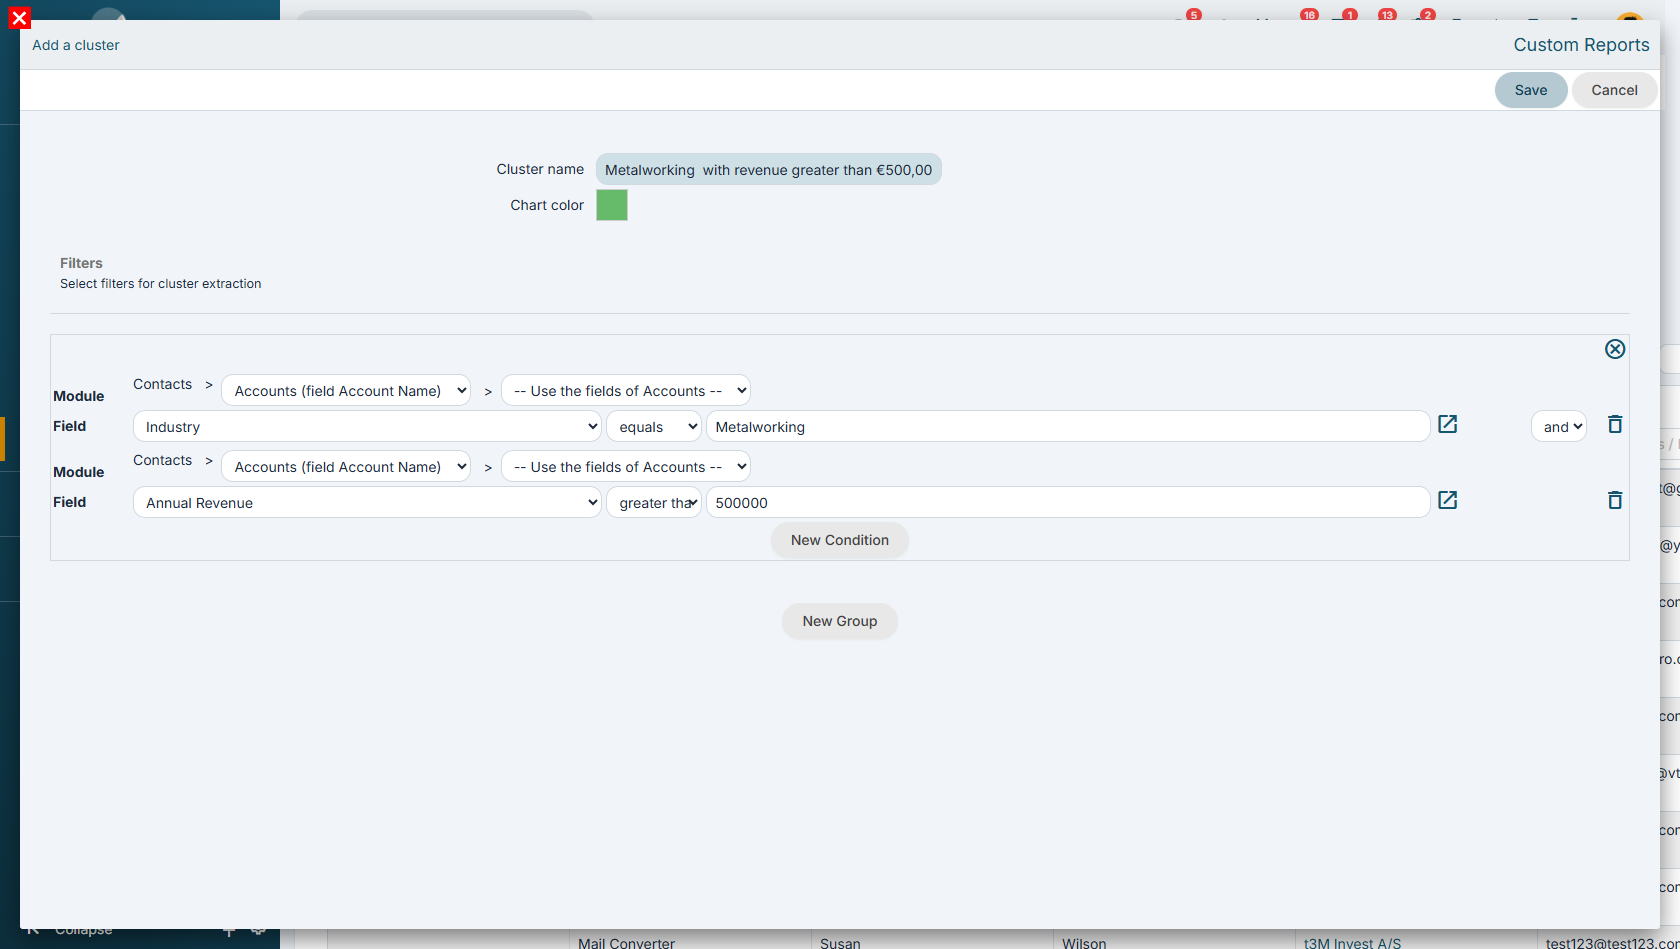
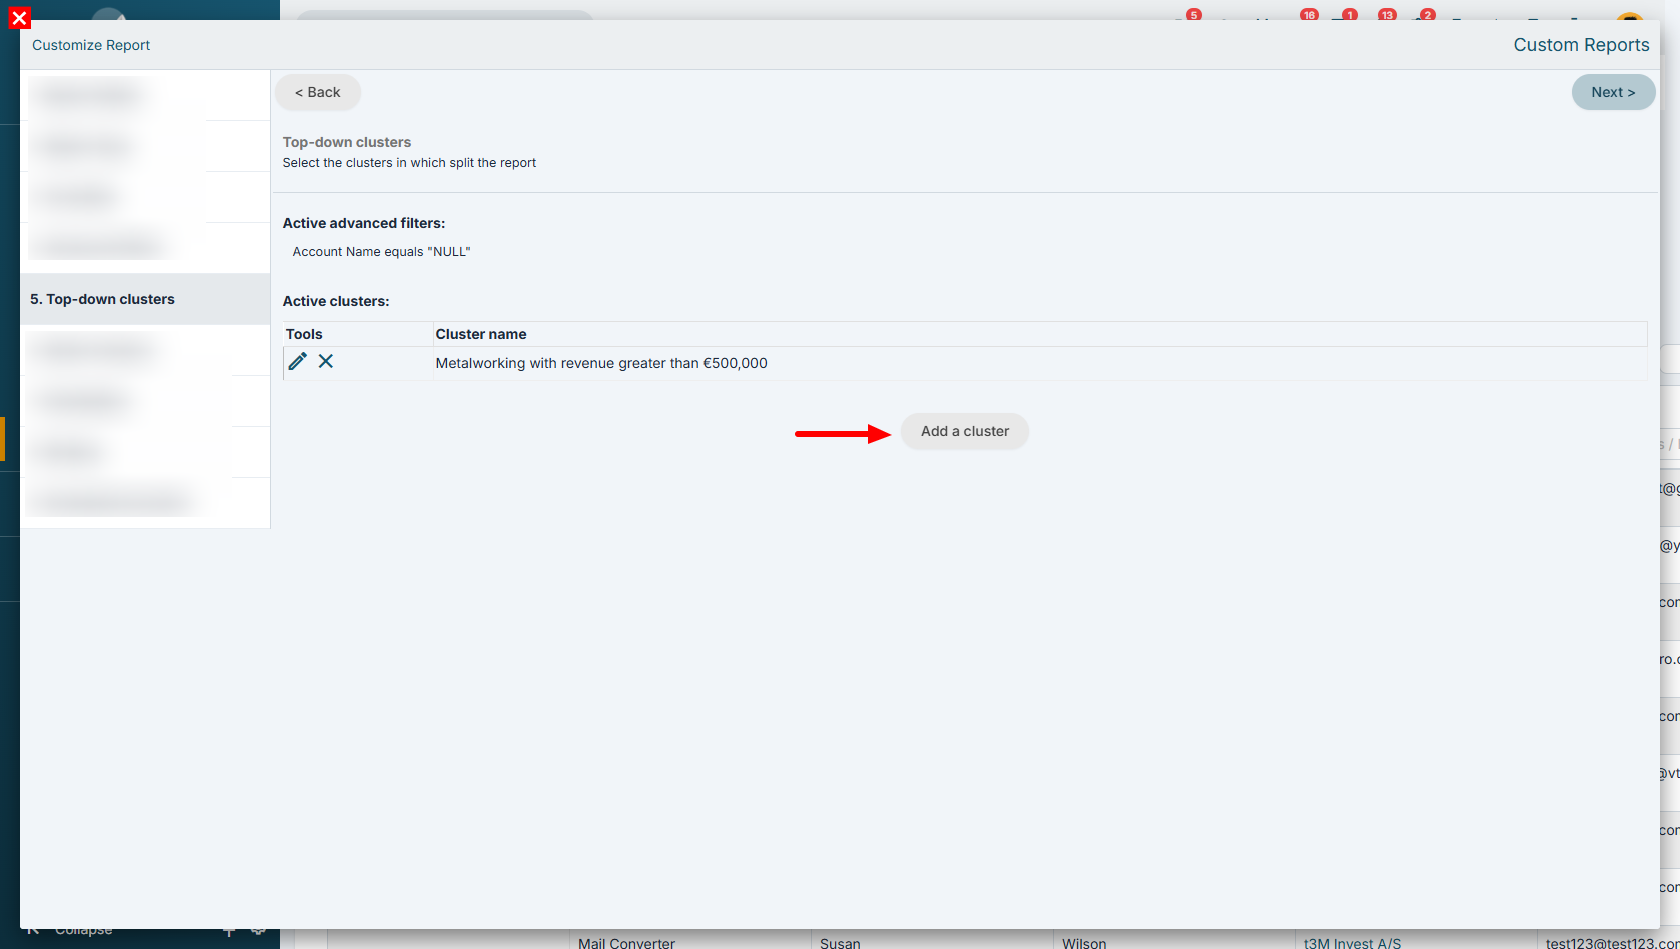
Once the segment configuration is completed, click the “Save” button to store it.
It is possible to create and add multiple segments within the same report, allowing data to be classified and compared according to different user-defined criteria.
It is important to emphasize that segments do not act as filters, but rather as a way to classify the records returned by the report.
This means that while Advanced Filters and Time-Based Filters define the criteria used to limit the set of records included in the report, segments are used to further divide those records into groups based on specific conditions.
Records that do not meet the conditions of any segment are not excluded from the report. Instead, they are automatically assigned to a default “null” segment, identified by the “-” symbol.
In this way, the report always displays all retrieved records, distinguishing those that belong to defined segments from those that do not fall into any configured classification.
In particular, the Segment column is added as the first column in both the Report and Summary tabs, and it is also used as the primary grouping criterion for data aggregation.
Below are some practical examples of how the segmentation feature can be used.
Opportunity segmentation based on closing time
(using, for example, a “Closing Days” field)
-
1 to 30 days
-
31 to 50 days
-
51 to 100 days
-
over 100 days
Lead segmentation based on last contact date
(using, for example, a “Last Contact Date” field in the record)
This allows the creation of charts showing:
-
Leads not contacted for over 120 days
-
Leads not contacted for over 60 days
-
Leads not contacted for over 30 days
Customer classification based on revenue
-
up to €10,000
-
€10,001 to €50,000
-
over €50,000
Ticket segmentation based on resolution time
-
resolved within 24 hours
-
resolved between 1 and 3 days
-
resolved after more than 3 days
Creating groups based on multiple conditions
Segments can also be defined using multiple criteria simultaneously. For example:
-
customers with revenue over €100,000 and located in the Lazio region
-
customers with at least one open opportunity and no contacts in the last 90 days
-
companies belonging to a specific industry and with more than 50 employees
Comparing customer performance across different years
Segmentation can be used to compare, for example:
-
the same customer's revenue across two consecutive years
-
the number of open opportunities in different years
-
the evolution of sales over time
Comparing product sales performance
Segments can be created to compare:
-
sales of the same product across different years
-
quantities sold per year